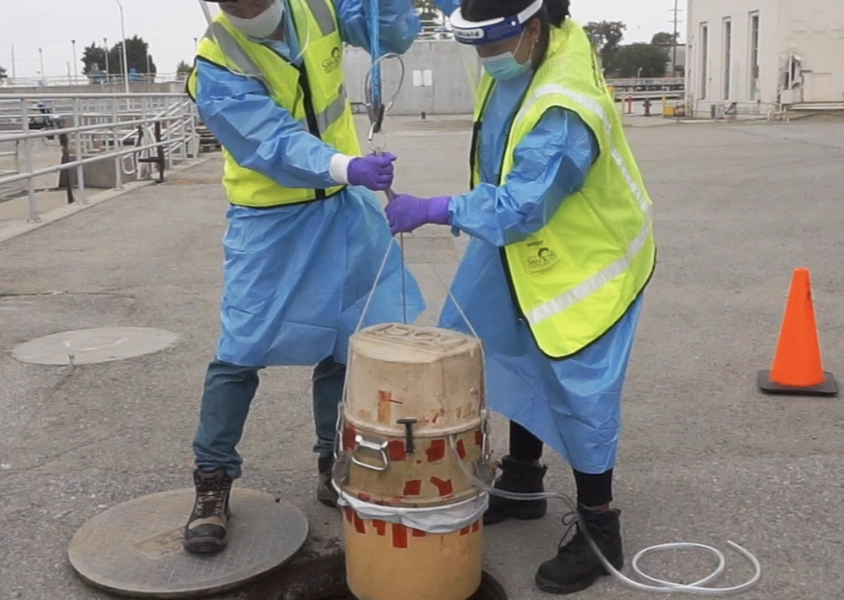
NYT Wastewater data has become perhaps the best metric to track the spread of the virus in the U.S., but it’s an imperfect tool.
The curves on some Covid graphs are looking quite steep, again.
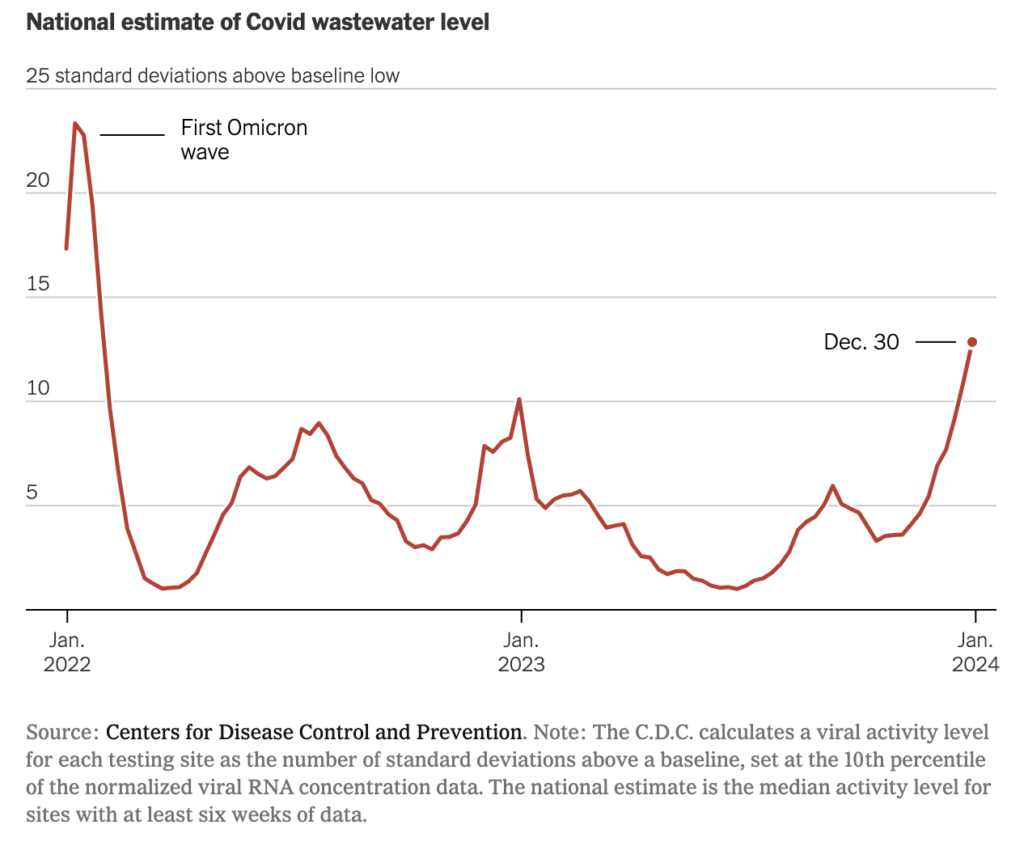
Reported levels of the virus in U.S. wastewater are higher than they have been since the first Omicron wave, according to data from the Centers for Disease Control and Prevention, though severe outcomes still remain rarer than in earlier pandemic winters.

“We are seeing rates are going up across the country,” said Amy Kirby, program lead for the C.D.C.’s National Wastewater Surveillance System. The program now categorizes every state with available data at “high” or “very high” viral activity.
The surge might reach its peak this week or soon after, modelers predict, with high levels of transmission expected for at least another month beyond that. Hospitalizations and deaths have remained far lower than in previous years. There were around 35,000 hospitalizations reported in the last week of December — down from 44,000 a year earlier — and 1,600 weekly deaths as of early December, down from 3,000. (At the same time in 2020, there were around 100,000 hospitalizations and 20,000 deaths each week.)
